import numpy as np
import matplotlib.pyplot as plt
from scipy.interpolate import interp1d, CubicSpline
# --------------------------
# Data points
# --------------------------
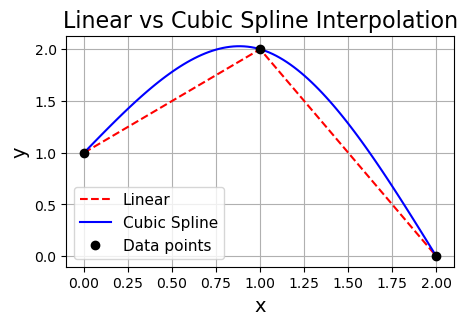
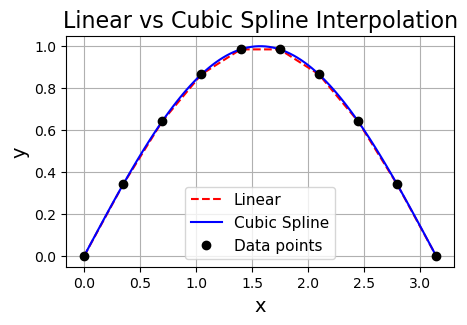
x = np.array([0, 1, 2])
y = np.array([1, 2, 0])
# --------------------------
# Linear interpolation
# --------------------------
linear_interp = interp1d(x, y, kind='linear')
# --------------------------
# Cubic spline interpolation (natural)
# --------------------------
cubic_interp = CubicSpline(x, y, bc_type='natural')
# --------------------------
# Evaluation points for smooth plot
# --------------------------
x_plot = np.linspace(0, 2, 100)
y_linear = linear_interp(x_plot)
y_cubic = cubic_interp(x_plot)
# --------------------------
# Plot results
# --------------------------
plt.figure(figsize=(5,3))
plt.plot(x_plot, y_linear, 'r--', label='Linear')
plt.plot(x_plot, y_cubic, 'b-', label='Cubic Spline')
plt.plot(x, y, 'ko', label='Data points')
plt.title('Linear vs Cubic Spline Interpolation', fontsize=16)
plt.xlabel('x', fontsize=14)
plt.ylabel('y', fontsize=14)
plt.legend(fontsize=11)
plt.grid(True)
plt.show()